1.5 Q-1
Question Statement
Draw the graphs of the following equations:
Background and Explanation
This question requires understanding the process of graphing equations, including:
- Types of Graphs: Circle, ellipse, and exponential functions.
- Symmetry: Checking symmetry with respect to axes and origin.
- Table of Values: Choosing specific values of to calculate for plotting.
- Domain and Range: Determining the feasible values of and .
A general understanding of basic algebra, trigonometry, and exponential functions is helpful.
Solution
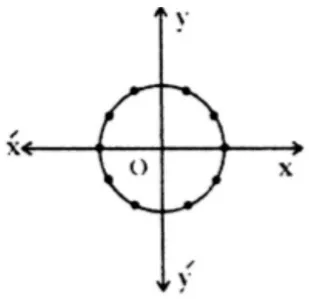
Part 1:
Steps:
-
Rewriting the equation:
Express in terms of :
-
Key Characteristics:
- Domain: , since .
- Range: .
- Symmetry: The graph is symmetric about both axes and the origin (a perfect circle).
-
Plotting: Plot the points and connect them smoothly to form a circle.
-
Graph:
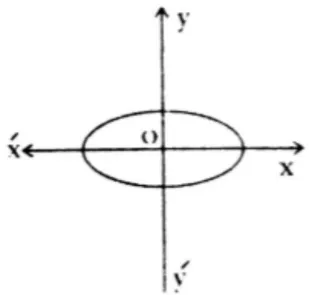
Part 2:
Steps:
-
Rewriting the equation:
-
Key Characteristics:
- Domain: , since .
- Range: .
- Symmetry: Symmetric about both axes and the origin (ellipse).
- Major axis: Horizontal (length = 8).
- Minor axis: Vertical (length = 4).
-
Plotting: Plot the points and connect them smoothly to form an ellipse.
-
Graph:
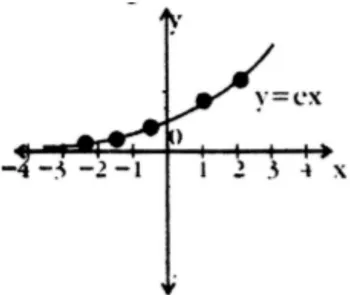
Part 3:
Steps:
-
Key Characteristics:
- Exponential growth.
- Domain: .
- Range: .
- Asymptote: as .
-
Plotting: Plot the points and connect them to form an exponential curve.
-
Graph:
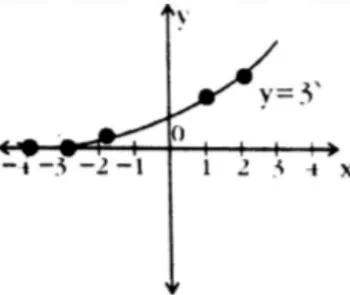
Part 4:
Steps:
-
Key Characteristics:
- Exponential growth similar to but with base 3.
- Domain: .
- Range: .
-
Plotting: Plot the points and connect them to form an exponential curve.
-
Graph:
Key Formulas or Methods Used
- Circle: .
- Ellipse: .
- Exponential Functions: or .
Summary of Steps
- Rearrange the equation to isolate or simplify plotting.
- Determine domain and range for feasible and values.
- Create a table for specific values and their corresponding values.
- Plot points on a graph and connect smoothly.
- Identify key features like symmetry, intercepts, and asymptotes.