1.5 Q-2
Question Statement
Graph the curves described by the following parametric equations:
i.
ii.
iii. , where is a parameter.
Background and Explanation
Parametric equations involve expressing both and in terms of a third variable, often denoted as or . These equations represent a relationship between and that is not necessarily solvable for one in terms of the other, but can still describe curves when plotted.
In each of these problems, we need to understand how the parametric equations define the relationship between and , and how to sketch these curves by eliminating the parameter.
Solution
i.
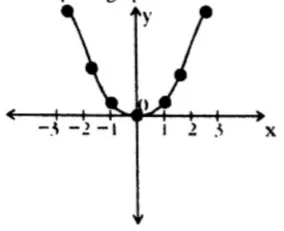
The parametric equations describe a parabola opening upwards. For each value of , there is a unique positive value of , so this equation defines as a function of .
Steps:
- We have , where and .
- The graph is symmetric along the positive -axis and passes through the origin.
Table of values:
| -3 | -2 | -1 | 0 | 1 | 2 | 3 | |
|---|---|---|---|---|---|---|---|
| 9 | 4 | 1 | 0 | 1 | 4 | 9 |
Plotting the points and connecting them smoothly results in a parabola opening upwards:
ii.
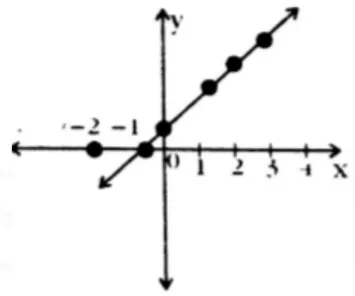
These parametric equations describe a line. We can eliminate the parameter by solving for in one equation and substituting into the other.
Steps:
- From , we get .
- Substituting into , we get , which simplifies to .
- This is the equation of a straight line with a slope of 2 and a y-intercept of 1.
Table of values:
| -2 | -1.5 | -1 | -0.5 | 0 | 0.5 | 1 | 1.5 | 2 | 3 | 4 | |
|---|---|---|---|---|---|---|---|---|---|---|---|
| -3 | -2 | -1 | 0 | 1 | 2 | 3 | 4 | 5 | 7 | 9 |
Plotting the points and connecting them smoothly results in a straight line:
iii. , where is a parameter
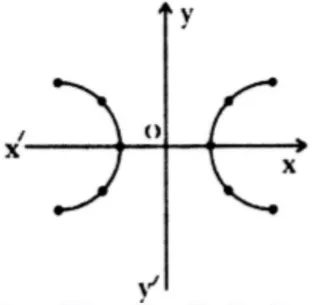
These parametric equations represent a hyperbola. We can eliminate the parameter by using the identity .
Steps:
- From the parametric equations, we know , which is the equation of a hyperbola.
- The domain of is , and the range of is .
- The graph is symmetric about the -axis, -axis, and the origin.
Table of values:
| -2 | -1 | 0 | 1 | 2 | 3 | 3.5 | 4 | 4.5 | 5 | 5.5 | |
|---|---|---|---|---|---|---|---|---|---|---|---|
| -3 | -2 | -1 | 0 | 1 | 7 | 8 | 9 | 10 | 11 | 12 |
Plotting the points and connecting them smoothly results in two different straight lines with inclinations and :
Key Formulas or Methods Used
- Eliminating the Parameter:
- For linear equations, eliminate the parameter by solving one equation for the parameter and substituting it into the other.
- For the hyperbola, use the identity .
- Symmetry of Graphs:
- Parabolas and straight lines often exhibit symmetry (in this case, symmetry along the -axis for the parabola, and no symmetry for the line).
- Graphing:
- After calculating the values from the equations, plot the points on a graph and connect them smoothly to reveal the curve.
Summary of Steps
-
For the first curve:
- Recognize the parametric equations represent a parabola.
- Plot the values for and from the table, and sketch the graph.
-
For the second curve:
- Eliminate the parameter to get a linear equation.
- Plot the points and connect them to form a straight line.
-
For the third curve:
- Use the identity for the hyperbola.
- Plot the points and connect them to form the two branches of the hyperbola.